
Investments
The Greed/Buy, Fear/Sell Behavior Gap sketch from our colleague Carl Richards is a bit cheeky. His sketches are meant to provoke a response and deeper query. We did not want to miss this opportunity for deeper reflection, as we are steeping in the brine of fear. That’s what markets provoke in most if not all of us – fear.
FOMO (fear of missing out) is the rise of markets – climbing to new highs. Fear of loss grips us when the markets decline. Market fluctuations cause us to react based upon how well we are centered in sufficiency. How embodied do we carry our Okayness? Perhaps it gets old to read and receive repeating messages of being OK and feeling safe. But brain science is giving us reliable data we can engage for our health, well-being, and ability to navigate the ups and downs of the market.
Our nervous system carries a message which tells our brains that we are desperate to survive. Our brains signal a fear response (fight, flee, freeze or faint) and we activate our unique fear pattern. Some of us activate by mobilizing – fight or flee. Some of us activate by immobilizing – freeze or faint. Most of us do a combination. Our brain signals create future worry in the form of survival thoughts and strategies to solve the future made-up problem. We can get stuck in futurizing and awfulizing.
The most effective way “out” to your truth and resourcefulness is recognizing your “OKness” in this moment, and practicing sufficiency. Embodied sufficiency is the recognition that you are OK and that you have everything that you need to be fully present on the earth right now. It assists in calming your nervous system and providing the nourishing chemicals to shift your brain state from fear to presence.
When you are feeling scared and anxious, try breathing deeper in your body. Try feeling your feet on the floor. Try sitting on the ground. These moves tell your body that you are doing fine even when your brain says otherwise.
Bear Anxiety

Rich Colman
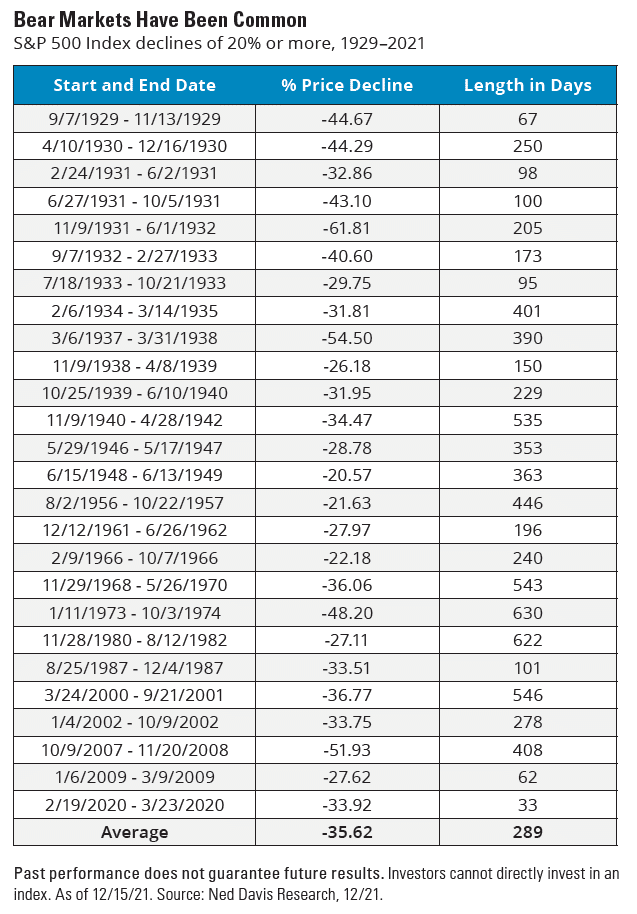
It now appears that we are on the cusp of experiencing the 29th bear market in U.S. stocks since 1929. That’s right, we average a bear market about every three years! And the bear markets usually last less than a year.
Below is a chart showing how common bear markets actually are, and that their duration is relatively short:
The news reports are talking about ‘market uncertainty,’ which is a nice euphemism for the anxiety that people expectedly experience when their portfolios drop in value. But there really isn’t anything ‘uncertain’ about an 18% decline from the recent market highs. And if you want to look at the broader definition of that term, is there ever any time when we are NOT ‘uncertain’ about future prices and market trends? The S&P 500 remains more than 16% above its pre-Covid high in early 2020, which could not have been predicted when the pandemic hit. The current downturn could only have been predicted to the extent that all bull markets eventually turn into bears, which have, in the past, always turned back into bull markets again.
If the markets do nudge down that last 2% and enter the technical definition of a bear market, then some will fear that the losses will be permanent—that is, the markets will never recover to their former highs or, worse, the downturn will continue until stocks are valued at $0. Of course, neither of these have ever happened. Theoretically it is possible to happen but then the US dollar would also be worthless and the probability of that happening is the same as a comet that hit the earth that wiped out the dinosaurs does the same in our lifetime. Yes, these things are (remotely) possible, just like it’s possible that the Sun will explode tomorrow, but the far more likely scenario is that at some point in the next year or two, the markets will once again be testing new highs.
The anxiety that investors experience (us too, by the way) is about losing the ability to pay for our future lifestyle. To address that anxiety directly, you need to think about how soon you need the money that is invested in the markets to pay for your daily or weekly expenses. If you’re earning enough income to cover those expenses, then you can weather a 12-24 month market storm and (if the past is any indication of the future) come out on the other end with more than you had before. If you’re retired and receiving Social Security and/or a pension, and have cash set aside to pay the remainder of your expenses for the next year or two, then you really shouldn’t give in to anxiety.
It’s only the people who need that money they’ve invested right now who stand to lock in their losses—and they deserve our sympathy for what they’re going through with the market turbulence. The rest of us should probably relax, even if it’s easier said than done.
Bond Markets
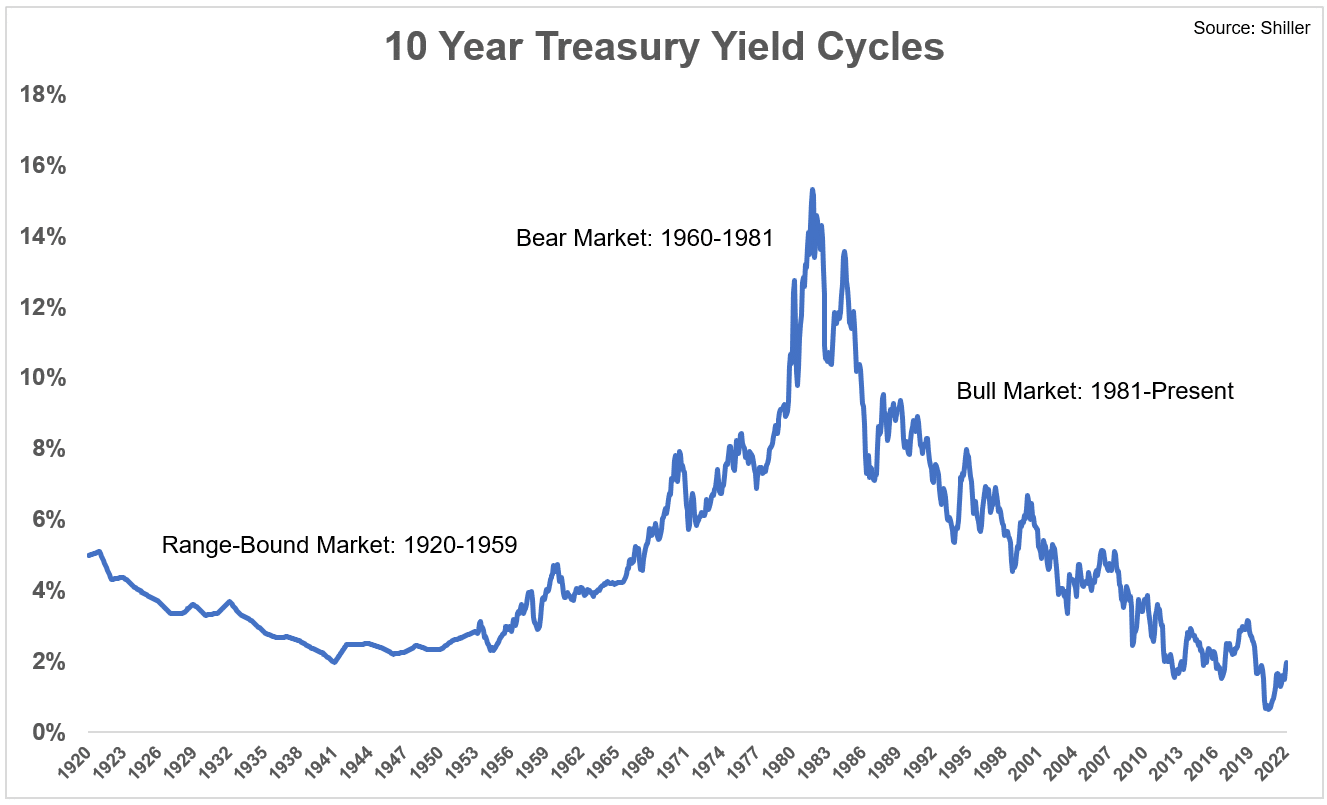
Now that we discussed equity bull markets, we can discuss the apparent Bond bear market we are witnessing and what does that mean. Bond bull and bear markets seem to last much longer. The length of time appears to be related to the amount of time it takes the Federal Reserve to tame inflation.
The last bear bond market started in 1960 and did not end until 1981. We have been in a bull bond market for the last 41 years. That’s right; interest rates had been trending downward for over 40 years. Now they are rising, which for many of us is a new experience. Now remember during the last bond bear market, we had 5 bear markets and 4 bull markets. During this 40-plus year bull market in bonds, we had 6 bear equity markets and 8 bull equity markets, as measured by the S&P 500 stock index.
Since 1929, there have been 14 times that the US economy contracted for at least 2 consecutive quarters (counting the Great Depression and the Great Recession). This means that within the last century, we average a recession every seven years.
During this period, no recession lasted more than 3 years and 7 months (the Great Depression of 1929.) That also means that we have had recessions during the past two bull and bear bond markets. Currently, we cannot determine whether the Federal Reserve will throw the US economy into a recession, but if it does, interest rates will be lowered quickly and we may see another round of Quantitative Easing by the Federal Reserve (buying bonds).
The below chart lists each of the last 14 recessions/depressions. Recessions happen fairly often and their duration is usually rather short, as both the Federal Reserve and the Federal Government act to expand the economy.
| Name | Period Range | Duration (months) | Time since previous recession (months) |
| Great Depression | Aug 1929–Mar 1933 | 3 yrs. 7 mos. | 1 yr. 9 mos. |
| Recession of 1937–1938 | May 1937–June 1938 | 1 yr. 1 mo. | 4 yrs. 2 mos. |
| Recession of 1945 | Feb 1945–Oct 1945 | 8 mos. | 6 yrs. 8 mos. |
| Recession of 1949 | Nov 1948–Oct 1949 | 11 mos. | 3 yrs. 1 mo. |
| Recession of 1953 | July 1953–May 1954 | 10 mos. | 3 yrs. 9 mos. |
| Recession of 1958 | Aug 1957–April 1958 | 8 mos. | 3 yrs. 3 mos. |
| Recession of 1960–61 | Apr 1960–Feb 1961 | 10 mos. | 2 yrs. |
| Recession of 1969–70 | Dec 1969–Nov 1970 | 11 mos. | 8 yrs. 10 mos. |
| 1973–75 recession | Nov 1973–Mar 1975 | 1 yr. 4 mos. | 3 yrs. |
| 1980 recession | Jan 1980–July 1980 | 6 mos. | 4 yrs. 10 mos. |
| 1981–1982 recession | July 1981–Nov 1982 | 1 yr. 4 mos. | 1 yr. |
| Early 1990s recession | July 1990–Mar 1991 | 8 mos. | 7 yrs. 8 mos. |
| Early 2000s recession | Mar 2001–Nov 2001 | 8 mos. | 10 yrs. |
| Great Recession | Dec 2007–June 2009[74][75] | 1 year 6 months |
6 yrs. 1 mo. |
There is uncertainty about how high interest rates need to go in order to tame the current spate of inflation, and whether that activity by the Federal Reserve will unleash a recession. The recent equity and bond market declines reflect that uncertainty. Remember, capital markets (bonds and equity) react negatively to uncertainty.
So far, the Federal Reserve has had to increase interest rates to reduce demand for goods and services; enough to quell the current inflation expectations which are higher than the Federal Reserve’s current target. It is unknown whether the Federal Reserve can raise rates without throwing the US into a recession. We won’t know that for a while but if we are thrown into a recession, then we can quickly expect interest rates to decline as demand for good and services withers.
Source:
https://en.wikipedia.org/wiki/List_of_recessions_in_the_United_States
