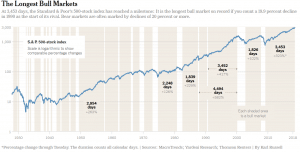
A Bull market is defined as a period that starts at the bottom of the previous bear market (a market drop of at least 20%), and continues to move up without a new bear market drop of 20%. By that definition, we have been in a Bull market far longer than any previous Bull markets. Gross Domestic Product (GDP) is defined as the sum total of all economic activity of a nation, from midnight January 1st to midnight December 31st.
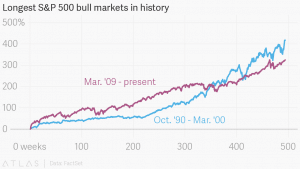
If we look back to March of 2009 (better than nine years ago), we can marvel at the slow pace of the US economic recovery versus the large gain of the stock market index. As of December 2009, GDP was $14.4 trillion, and by the end of 2017, that amount rose to $20.2 trillion. That represents a 40% rise in GDP over the 8-year time period. During the period since March 2009, the S&P 500 index has gained 321% in total—almost exactly tripling in value, not counting reinvested dividends. The current Bull market (which began March 9th, 2009) has provided very strong annual returns of 16.5%.
As you can see from the comparison, from March 2009 to today, the GDP rose 40%, while the S&P 500 index more than tripled. Now to be fair, during the 2008 to 2009 recession the GDP dropped a few percentage points (2.6%) while the S&P 500 index dropped 56%. The data points to the fact that the economic growth contributes to the direction of the stock market growth or fall, but not the degree to which it grows or falls. The key here is that small changes in GDP translate into large fluctuations in market movements (both up and down).
It should also be noted that the economic toll of a falling GDP, which amounts to lost jobs and failed businesses, is much greater on the average American than a corresponding drop in the equity market. Our attentions should be much more focused on the economy rather than the equity markets. However, the reality of human nature points us to watch the rise and fall of the equity market much more closely than the overall economy. In many ways, our attention is on the easy-to-measure-and-calculate statistic even though it is meaningless on a day-to-day basis, rather than the more important statistic, because it is not reported by the media as often.
The overall lesson is that as long as the US economy is growing decade to decade, we can expect the equity markets to also increase. That does not mean there will not be corrections and bear markets; it means that overall, if history is any indication for the future, the equity markets will continue to rise.
During the Great Depression, not a fantastic time for the US economy, a Bull market occurred from June 1932 through March of 1937. During this time, the equity markets rose 325%, or about 36% per year. During the Dot Com years (October 1990 through March 2000), which some people call a Bull market, investors who bought and held during that period saw total gains of 417%, or roughly 19% per year. During that same period, the US economy grew by almost 82%. It was a period of great economic growth before it collapsed.
Now, when the equity market has been rising for a good nine years, many investors may be nervous as to when the current Bull Market will cease, and how far the stock market will drop during the next pullback. The length of a market upturn is really not the proper measure to determine whether the markets are a good place for your hard-earned dollars. The best measures to track are first and foremost: the market environment. This includes what the executive in the corner office is thinking (expand or contract), consumer sentiment (buy or horde my cash), Federal Reserve policy (is the bank helping the stock market increase or setting it up to fall), government overall fiscal policy (is it creating more jobs by spending money or causing fewer jobs by taking more funds than it spends). We combine that with a view towards corporate revenue and profits, borrowing costs, inflation and the health of the overall economy.
The problem with these better measures is that they are so complex, with a $20 trillion GDP economy, that it may be months before we know whether the sum total is increasing and a good place to invest, or is it time to take our funds out of the stock market. Due to the difficulty of tracking such information, people focus on the meaningless indicator of whether stocks have managed to avoid a 20% drop over some arbitrary period of time.
Our approach remains steady. It is best to cease being in the guessing game of when the next Bear Market will raise its ugly head. It is better to base your investments on a combination of your cash needs and time horizon. The greater your cash needs in comparison to the size of your portfolio, the less your funds should be invested in the stock market. The shorter your time horizon, the less market risk you should take. It is best to base your investments on the dynamic flow of your life so that your investment posture is a skillful integration of your needs, desires and deepest longings rather than the current market cycle!
