The investment markets offer no guarantees; you lay your money on the table and take your chances. In the first quarter, those who placed their bets that U.S. stocks would enhance their wealth – plus, of course, those of us who stayed the course with our investment portfolios – were rewarded handsomely.

The above chart illustrates the favorable Q1 US broad equity returns from four indices. Specific index details are shown below:
- Wilshire 5000 index, the broadest measure of U.S. stocks and bonds, +10.91% – more than half of the strong gains it made last year.
- Russell 3000 index, comparable to the Wishire 5000, +11.07%
- Wilshire U.S. Large Cap index, +10.65%.
- Russell 1000 large-cap index, +10.96%,
- S &P 500 index, large company stocks, +10.03% and celebrated a new closing high of 1,569.19 on the last trading day of the quarter. (Its all-time high was an intraday peak of 1,576.09, set back in 2007.)
- Wilshire U.S. Mid-Cap index, +13.51% after gaining 16.25% all of last year.
- Russell midcap index, +12.96%
- Wilshire U.S. Small-Cap, +13.11%.
- Russell 2000 small-cap index,12.39%.
- Nasdaq Composite index, technology heavy, +8.21%.
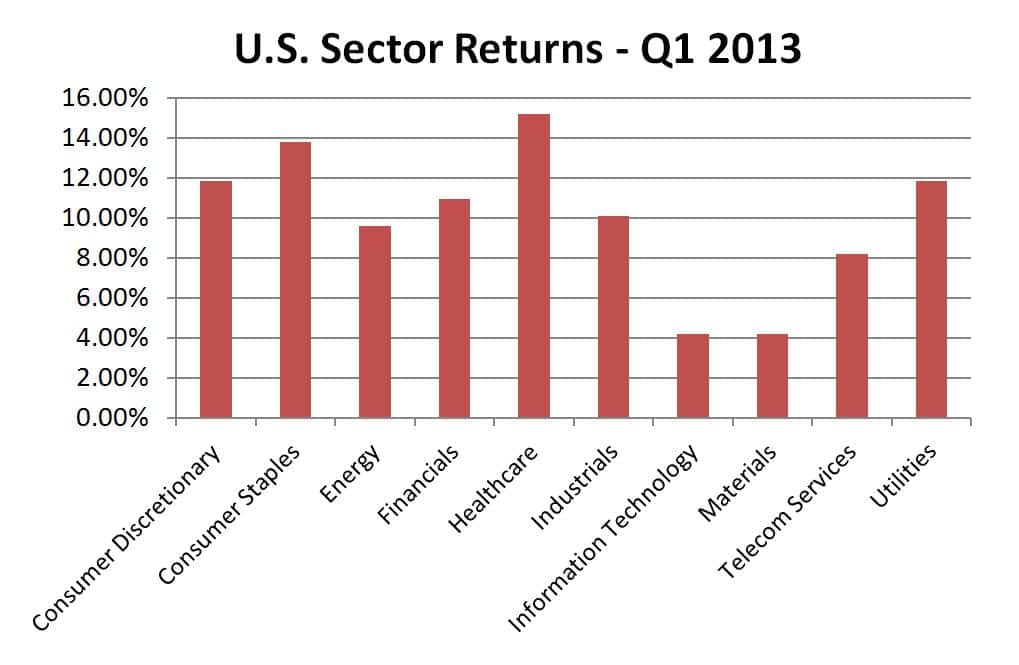
There was remarkable consistency across the industry sectors that make up the S&P 500. For the quarter, energy stocks rose 9.57%, materials were up 4.17%, industrials gained 10.08%, consumer discretionary stocks rose 11.76%, consumer staples were up 13.77%, health care companies rose an aggregate 15.22%, financials gained 10.92%, utilities were up 11.84%, and even telecom services and information technology companies gained value, up 8.20% and 4.21% respectively.
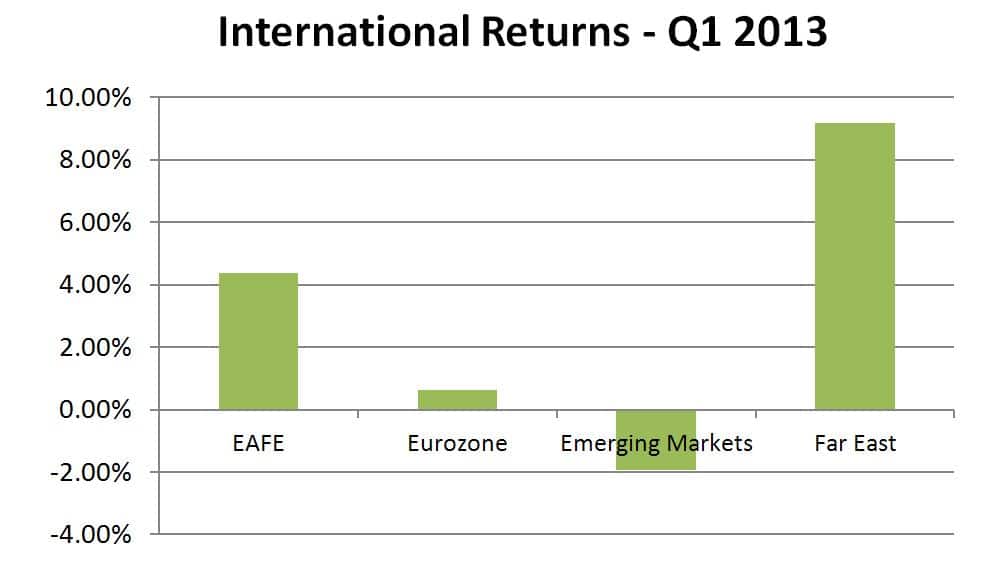
Studying global returns, it becomes clear that U.S. stocks delivered standout performance compared with the rest of the world. The broad-based EAFE index of larger companies in developed economies rose 4.38% in dollar terms during the first quarter of the year. The stocks across the Eurozone economies eked out a 0.63% gain for the quarter, reflecting continued uncertainty over whether Spain and/or Italy will require restructuring help on their government bonds. Meanwhile, the Far East economies rose 9.18% the first three months of the year. The only truly negative investment performance news comes from the EAFE Emerging Markets index of lesser-developed economies, which fell 1.92% for the quarter.
Looking over the other investment categories, real estate investments, as measured by the Wilshire REIT index, posted a 7.43% gain for the quarter.
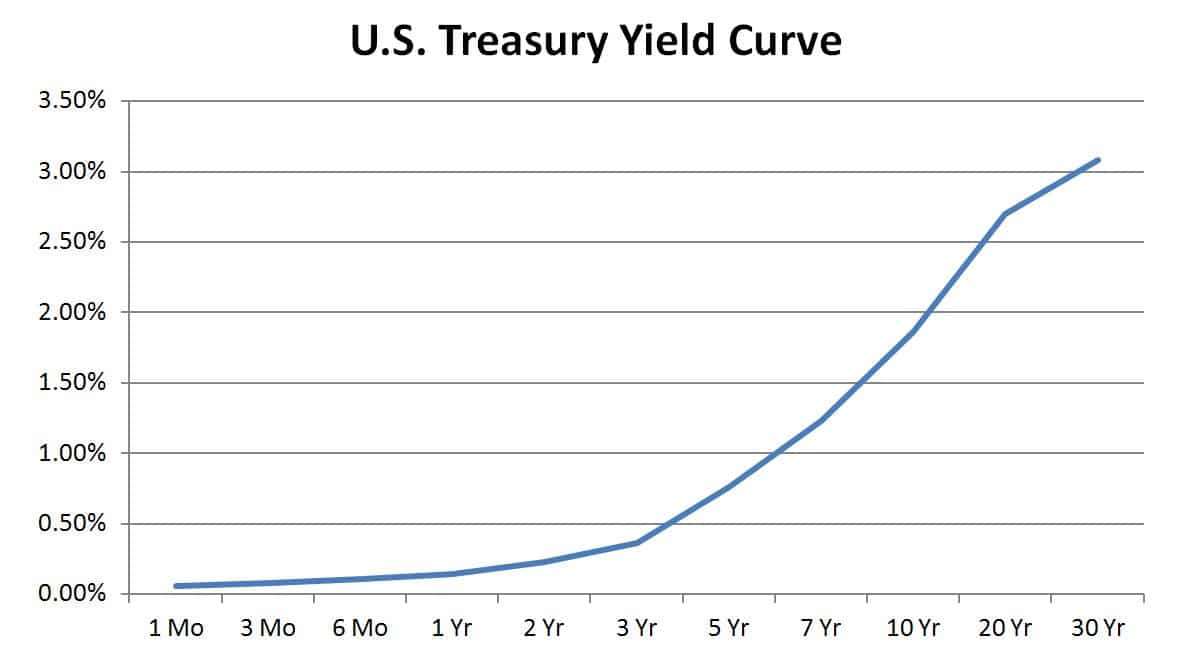
Investors who retreated to a perceived safe bond category deserve our sympathy, especially if they are using the coupons for retirement income. Treasury bonds continue to post near-record low yields. Today, if you lend the U.S. government money by purchasing a 2-year Treasury bond, your coupon rate is 0.24% a year. Lend the US hundred dollars and you get back less than a quarter every 12 months. Five-year yields are still below 1% (0.76%), and 10-year (1.85%/year) and 30-year (3.10%). T-bonds are not in danger of enriching their purchasers. Muni bonds are sporting aggregate yields of 0.24% (1-year), 0.36% (2-year), 0.92% (5-year) and 1.96% (10-year).
It’s hard to believe that the U.S. and global economies continue to suffer a hangover from the Great Recession, but the fact that the Federal Reserve Board keeps interest rates artificially low, coupled with still-high unemployment, makes the case. So, too, does unusually slow and bouncy economic growth; the U.S. economy, measured by the Gross Domestic Product, rose at a 0.4% annual rate in last year’s fourth quarter, after a 3.1% gain in the previous three months.
However, there have been some optimistic signs. Consumer spending, which accounts for roughly 70% of the U.S. economy, rose in February by the highest rate in five months, according to the Commerce Department. Although the gain was a modest 0.7%, the fact that people were spending more surprised many economists, who expected that the two percentage point increase in the payroll tax would cause Americans to feel poorer when they received their paychecks.
Rising home values and wage gains across the economy have made it easier for households to repair their finances. Incomes were up 1.1% in February and the overall U.S. savings rate managed to climb from 2.2% to 2.6% despite the increased spending and higher taxes. Home property values, measured by the S&P/Case-Shiller Index, rose 8.1% over the past year, the biggest year-to-year gain since 2006. Inflation is still low; the core measure which excludes food and fuel costs rose 0.1% from the prior month, in line with the 1.3% jump in the year since February 2012. And unemployment is finally trending downward. Employers added a net 355,000 workers in the first two months of the year. Rhode Island, Vermont, California and New Jersey showed the biggest declines in unemployment rates.
Does this mean the economic recovery will accelerate, boosting stock prices to ever-higher levels? Or are today’s record stock prices a sign that the market is about to take a plunge? Alas, only somebody with a working crystal ball can answer these questions. What we DO know is that the most successful investors are fearful when everyone around them is greedy, and greedy when other investors are fearful. For the past year, investors have been extremely nervous about U.S. deficits and the continuing debt crisis in Europe, yet stock market returns were excellent last year and unusually high in the first three months of this year.
Eventually the U.S. economy and the global markets will recover their mojo, and the Great Recession of 2008 will become a distant memory. Historically, the markets have delivered positive returns about 70% of the time, which is much better odds than you are likely to find in a casino.
SOURCES:
Wilshire index data: http://www.wilshire.com/Indexes/calculator/
Russell index data: http://www.russell.com/indexes/data/daily_total_returns_us.asp
S&P index data: http://www.standardandpoors.com/indices/sp-500/en/us/?indexId=spusa-500-usduf–p-us-l–
Nasdaq index data: http://quicktake.morningstar.com/Index/IndexCharts.aspx?Symbol=COMP
International indices: http://www.mscibarra.com/products/indices/international_equity_indices/performance.html
Commodities index data: http://www.standardandpoors.com/indices/sp-gsci/en/us/?indexId=spgscirg–usd—-sp——
Treasury market rates: http://www.bloomberg.com/markets/rates-bonds/government-bonds/us/
Aggregate corporate bond rates: http://finance.yahoo.com/bonds/composite_bond_rates
Economic data: http://www.bloomberg.com/news/2013-03-29/consumer-spending-in-u-s-increases-by-most-in-five-months.html
